A simple browser debugger tool
No matter how fancy the breakpoint system is in Chrome and Firefox, I often find myself resorting to using console.log. But the problem is, console.log becomes unwieldy when looking at the logs. And so, a simple solution would be to instead leverage Chrome's and Firefox's developer tools to filter out the logs.
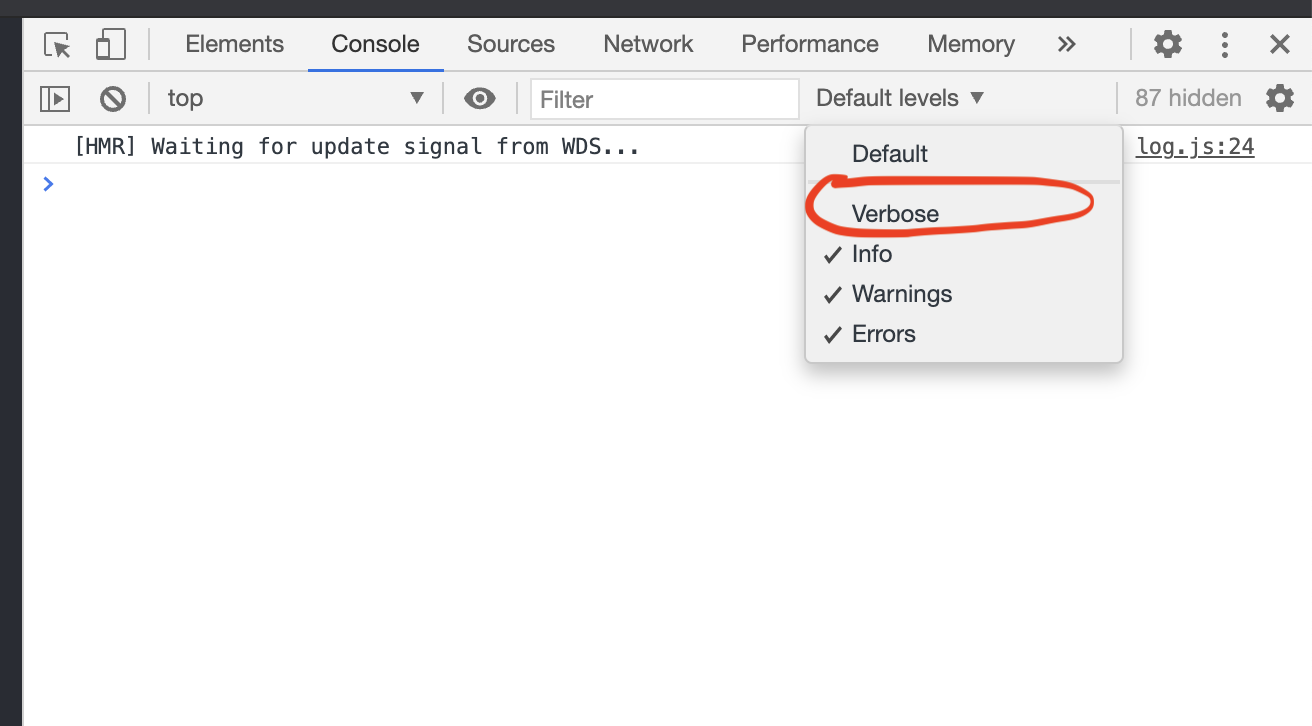
The console API has the debug method. So, instead of invoking console.log, you can invoke console.debug. In Chrome and Firefox, the debug logs are hidden by default, and the only way to see the logs would be to enable "verbose" logging on the console.
I also wote a library to better highlight logs. You can find the library here:
gist.github.com/shovo...19c0f1
You can use it like so:
import createDebugger from './debug':const debug = createDebugger('myapp:mymodule');console.log(...debug('Some log'));
This is what the logs look like:
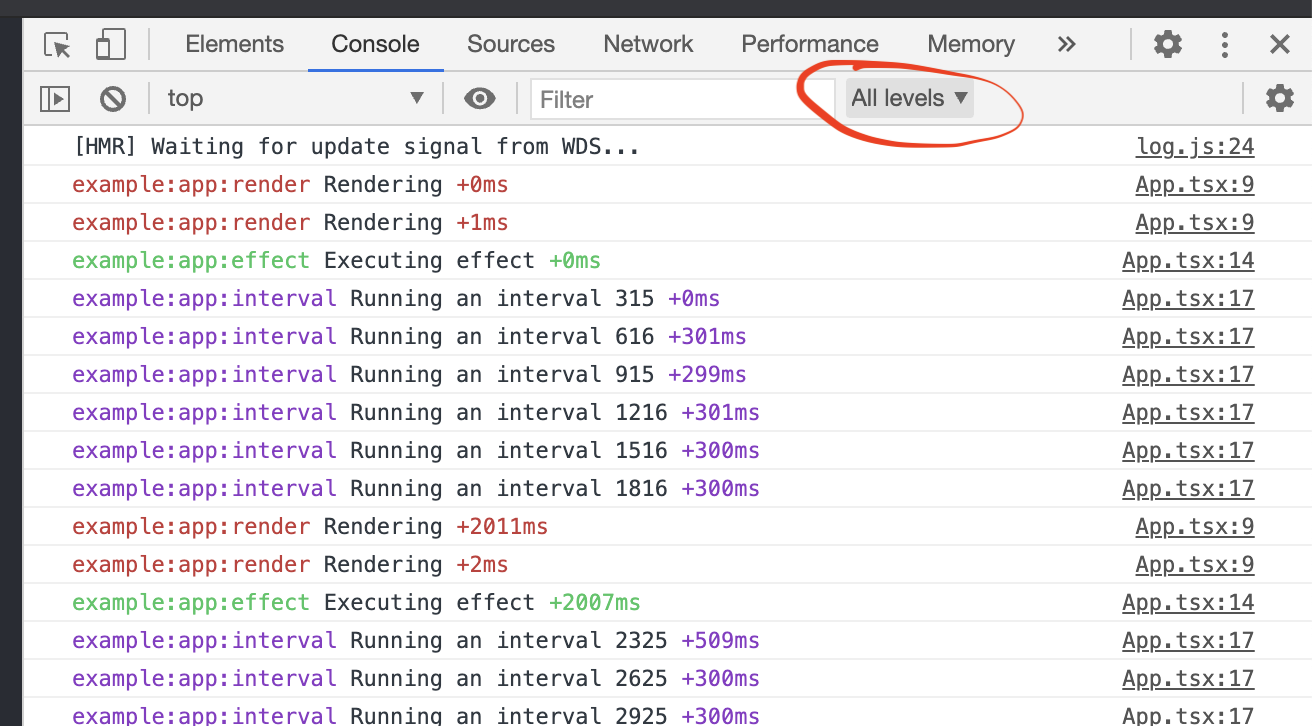
The Chrome console also has a filtering mechanism, that will allow you filter by regular expression, and so finding the appropriate log should be very easy to do.